
Most Parents Work
… and thus, isn’t school primarily daycare? This idea has intrigued me from the beginning of my research. I'm going to explore the daycare perspective from multiple viewpoints using history and data. This entry specifically looks at employment data from families with children.
My initial theory: If most parents work, they primarily need someone to watch their kids. It's been this way since the industrial revolution.
How many families need non-parental daycare for their kids? How many stay-at-home moms are there today? As a millennial growing up in a world heavily pushing women to be both CEOs and mothers, I’m assuming stay-at-home moms are not the majority in married households. Count the number of TV shows that feature the sharp, cutthroat female lawyer who is always rushing home late to take over from the nanny… “Housewife” is basically a derogatory term today but it shouldn’t be. I remember on my college application we considered listing my mom as a “domestic goddess” instead to sound better 🤦♀️. How about Mr. Moms?

Let’s dig into the numbers. I pulled the latest 2022 data from the Bureau of Labor Statistics (BLS). Specific table citations are at the bottom. Note that all this data is specifically looking at families and parents with kids under 18 years old.
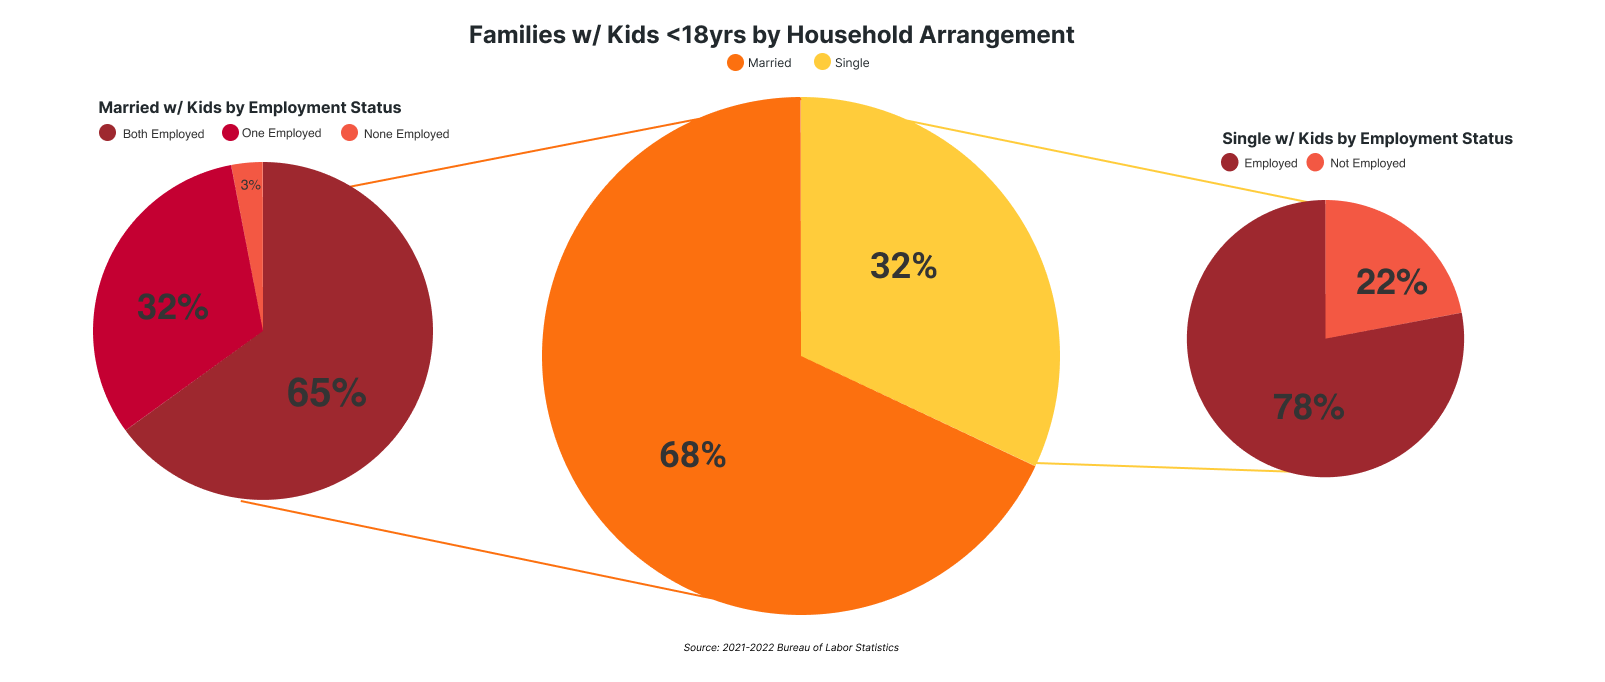
There are ~33.3 million families with children under 18.
- 68% of those families are married.
- 65% of those married families have both spouses employed.
- 78% of the single parents are employed.
Using a weighted average of the absolute numbers of these buckets ...
69% of households with children under 18 have both or the only parent employed.
Applying this percentage to the absolute number of families we get ~23 million families where everyone is working. When specifically considering just school-aged children (~5-17 years old), the numbers creep higher in all categories to a 72% average since kids under 5 have a higher percentage of mothers staying home.
Where are the housewives domestic goddesses?
We will find them in the 32% figure above of married households where only one spouse is employed.
- 27% of married families have a non-working wife, while 5% have a non-working husband.
- In absolute numbers, there are ~6 million stay-at-home moms versus ~16 million working wives and ~1 million stay-at-home dads versus 28 million working husbands.
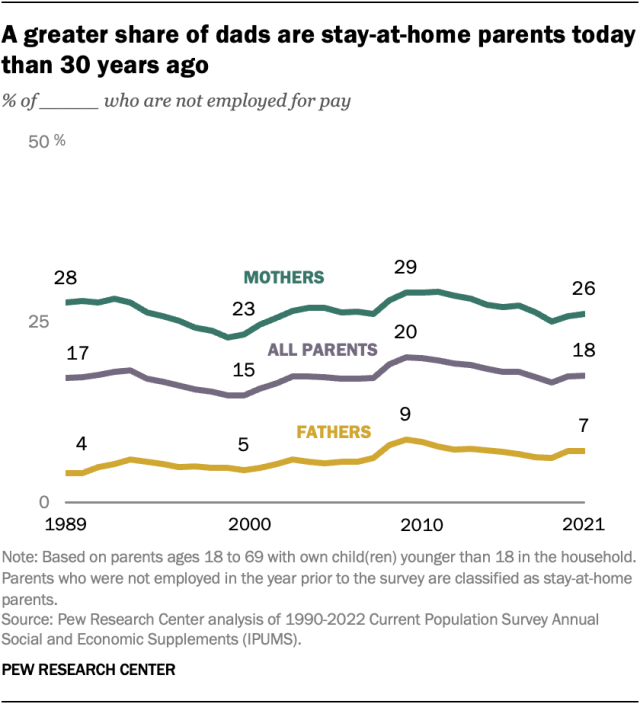
Sure, the title of the graph is interesting, but the fact that the percentage of stay-at-home moms has leveled off more or less since 1989 is also worth noting. Graphs from 1950s to today show a giant 📉 in married mothers staying home but now it appears to be stabilizing at a quarter.
What about full-time vs. part-time employment?
The BLS data I'm working with considers someone employed no matter if it's full-time or part-time. So maybe there's a large chunk of parents who are partially home?
~88% of all parents employed work full-time with children under 18. This is a large majority ... but I did more math.
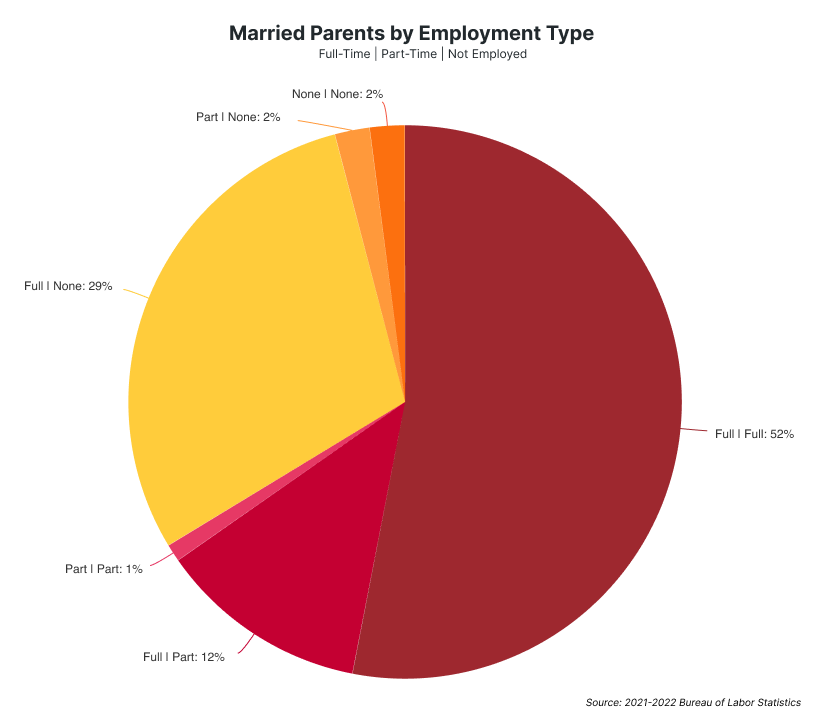
Looking specifically at married parents with kids under 18:
I had to do some degree of approximation here due to the full-time vs. part-time table being in individual units vs. family units but if you're married you can assume there are two individuals. All tweaks welcome on this math even though I checked it multiple times.
- ~52% of the married households have both parents working full-time.
- ~29%: one full-time, the other not employed.
- ~12%: one full-time, the other part-time.
Saying "most parents work" is true. Saying "most parents work full-time" is true. Saying "most married parents both work full-time" is true...barely.
What about the exceptions?
There are always exceptions, but they shouldn’t discount the importance of the data above, like so many writings on education try to do. Some exceptions might include:
- Parents who work from home on flexible hours.
- Those who have their own business that is more flexible than a 9-to-5.
- The percent of the part-timers reflected.
- Those with multi-generational living situations where another adult can watch the child.

Takeaways
- Most parents are working.
- Daycare appears to be necessary for most parents.
- There is a large minority of spouses not working full-time.
Next Steps
- Flip this data around and understand the numbers from the child perspective. How many children have their parents at work? Correlate that to school enrollment by type.
- Flip it on its head a different way. Test this theory: What if parents work because their kid goes to school, instead of kids go to school because their parents work?
- Understand the bucket of non 9-to-5-in-office-workers. Build a picture of how many people would be theoretically capable of sending their child to alternative schooling without rigid day care requirements.
- Dig into whether physically going to work has an effect on the need for child care versus simply just working.
- Write about how the industrial revolution is an impetus for needing daycare.
Table 4. Families with own children: Employment status of parents by age of youngest child and family type, 2021-2022 annual averages
Table 5. Employment status of the population by sex, marital status, and presence and age of own children under 18, 2021—2022 annual averages